After one of the largest speculative bubbles in history during the pandemic, the US housing market is now slowly tanking. Median home prices in the United States had risen about 45% in two years from Q1 2020 to Q1 2022, massively outrunning gains in wages and GDP.
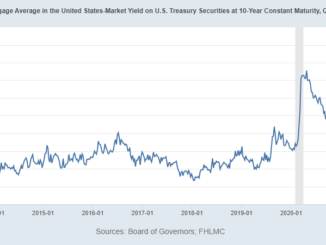
The Fed then hit the brakes, taking mortgages from 3% to 7% in the next six months and ballooning the monthly payment required to buy a median-priced home. Now, we’re starting to see the tightening work its magic on the housing market, with existing home sales plunging, purchase mortgage applications down to levels last seen in 1995, and price declines averaging a bit less than 1% per month.
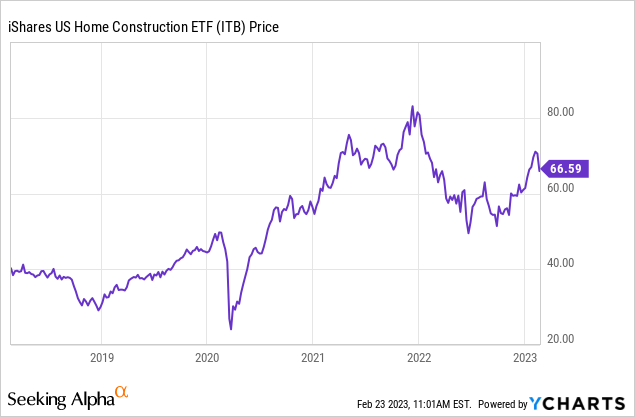
Despite this, housing-related stocks have levitated, as the entire market hopes that the Fed will pivot and things will go back to the old pandemic normal of panic buying. Since the lows in October, the iShares Home Construction ETF (BATS:ITB) is up an astonishing 31%, despite steadily worsening housing market fundamentals and mortgage rates threatening to push back above 7%, 8%, or higher.
The past few weeks have thrown some cold water on the rally, however. Home Depot (HD) recently disappointed investors with falling sales. Even as far back as January, there were some warning signs, such as KB Home (KBH) reporting that buyers canceled 68% of contracts. Are investors in housing and housing-related stocks whistling past the graveyard? Are we about to have a Minsky moment in housing? Let’s dig in.
Led by homebuilders and the cheerleaders at the NAR, there are housing mania deniers out there who insist that DTI ratios of 45% are perfectly reasonable for middle-class families buying middle-class homes, or that you should “date the rate and marry the house,” or that housing is always a sound investment.
Home builders tout their backlogs of interested buyers, but after seeing cancellation rates, I question whether these buyers are actually going to pull the trigger once they see the monthly payment they signed up for.
The truth is that the 21st-Century housing market is a highly-leveraged, speculative enterprise that makes or breaks the lifetime finances of young families – depending on how good they are at timing the market. It’s a “hunger games” of sorts, except the prize is often a house in the desert or swamp.
A lot of people intuitively understand this, especially those who lived through the last bubble in the 2000s. As a result, we’re seeing fewer and fewer people participate in the housing market. Existing home sales peaked at about 7 million per year in the 2000s bubble, but peaked at a slower pace of about 6 million during the pandemic bubble – despite a larger population.
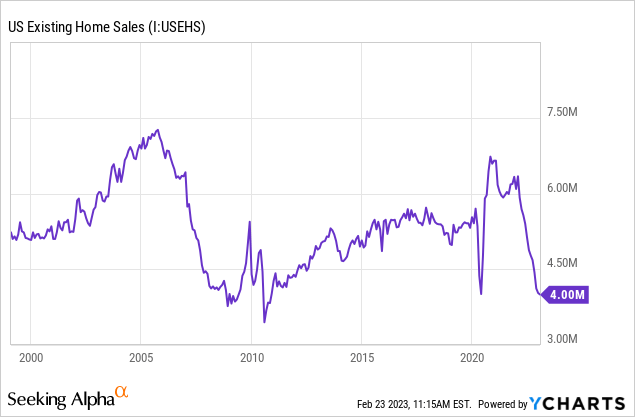
The high cancellation rates of homebuilders further show that buyers don’t want to buy at the top, and they don’t want to be burdened with excessive monthly payments for a house. Existing home sales are near 2008 lows, and there’s no indication that they’ll even bottom there. And purchase mortgage applications are indicating what may be on deck next.
Purchase Mortgage Applications Fall to 1995 Levels
Applications for mortgages are a useful leading economic indicator because they tell us how sales are going to be in the months ahead. And what applications for mortgages are telling us is that not many people want to buy homes at today’s prices.
And why would you, if prices are up 45% since pre-pandemic, and mortgage rates have gone from 3.5% to 7%? If it cost you $2,100 per month to buy a $600,000 home with a $500,000 mortgage before, now that house is about $850,000. If you make the same down payment, you’d need to pay about $5,000 per month on a $750,000 mortgage now, on the exact same house as three years ago. It’s not worth it!
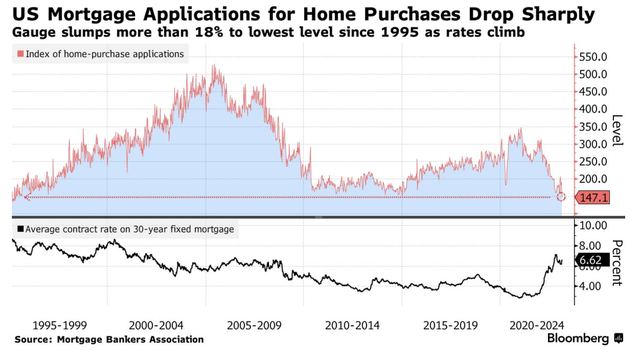
US Mortgage Applications (Bloomberg)
The way the relationship works is that purchase mortgage applications should lead sales here, which will in turn lead prices. With inflation still not fully under control, housing is going to get hit hard by rate hikes and QT. As the most interest rate-sensitive sector in the economy, there’s no way out for the housing market here.
Another interesting thing about the housing market is to think about incidence of tax arguments and apply them to monetary policy. A classic dictum in economics is that the party who physically pays a tax may not be the one who bears the burden.
For example, if a state decided to double property taxes overnight, landlords would be the ones writing the check, but if they are able to easily pass through the tax increases to renters, then the true incidence of the tax would fall largely on renters.
Now apply this to monetary policy – the Fed is heavily involved in the mortgage market and took mortgages from 4.5% to 3% during the pandemic with QE. Now, the Fed is trying to unwind this with QT and is getting out and letting the market set the rate. Mortgage rates have risen from 3% to 7% and may go even higher.
The benefit here largely went to buyers at first in 2020, because they could quit renting and get a nice monthly payment. Later in 2021 and 2022 the benefit went to sellers as prices skyrocketed.
In 2022, prices were still high along with investor psychology, so buyers bore close to 100% of the burden of the shift in monetary policy, borrowing at 5, 6, and 7% to pay bubble prices. Now, buyers are realizing that this is a bad deal and being “house poor” is no fun, so they’re dropping out of the market in record numbers.
What happens next is that the incidence of Fed tightening will soon shift more to the sellers as prices fall. And that’s exactly what we’re seeing. The key question for investors in ITB and housing stocks in general – with about 1.7 million US housing units under construction, who’s going to buy all of these? At first glance, homebuilders look like awesome stocks to buy, with huge earnings and low PE ratios. But when earnings turn to losses, PE ratios no longer matter.
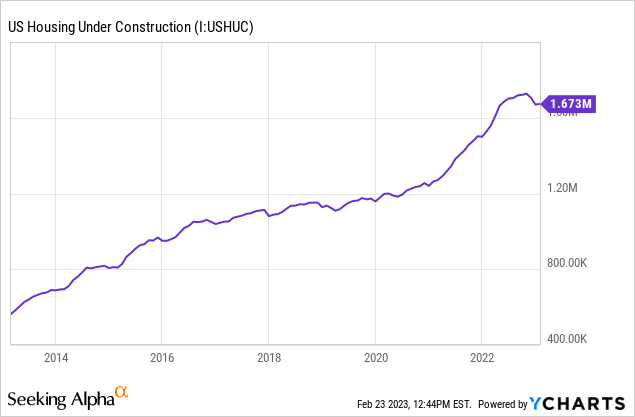
Home Prices Are Falling Fast
The Case-Shiller index is the most famous way to measure housing prices. Case-Shiller is good because it tends to avoid errors related to a changing sales mix that median price indexes suffer from. However, the issue with Case Shiller is that it lags the market by a few months. This is what Case-Shiller is showing now, with the latest data being from November.
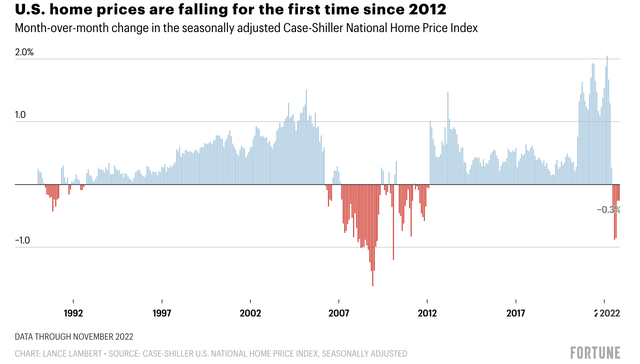
Case Shiller Index (Fortune)
Prices are falling steadily on average in the US. As we’ll see in a second, this differs by region, but the declines are spreading and deepening. Statistically, there still will be a few bidding wars in hot markets (which you’re sure to hear stories of), but these are fewer, while anecdotes of housing sitting on the market are beginning to proliferate.
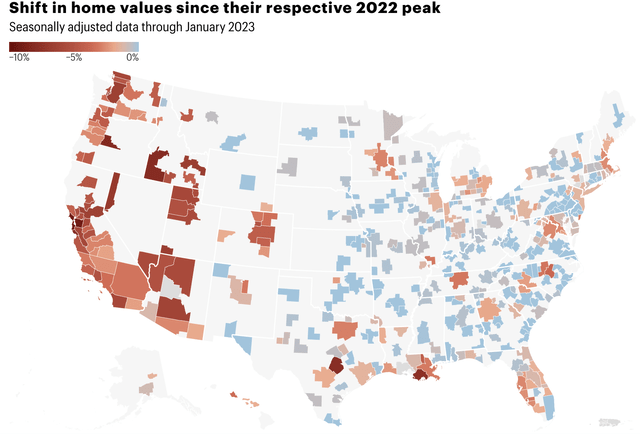
Home Price Declines (Fortune)
Home price declines began in West Coast metros, which have been losing population since the pandemic started but still had an epic, irrational boom in home prices. All of the more speculative markets were next to follow suit, including Las Vegas, Boise, and Austin. Next to start falling were the popular pandemic darlings such as Dallas-Fort Worth, Charlotte, Nashville, and Tampa.
Now, we’ve seen the price declines spread to East Coast markets such as Boston, New York, and DC. Miami has been the main holdout so far, but prices are starting to fall there as well. Prices in most markets are generally falling at a rate of around 1% per month, which is consistent with the 2000s housing bust.
And research shows that when home prices start to fall, they generally do so for multiple years, not months like the stock market. Studies in experiential economics confirm this – housing markets are vulnerable to extended bubble periods followed by years-long busts. And in the housing bubble bellwether of San Francisco, recent transactions are indicating price declines that are potentially deeper and faster than the first housing bubble in the 2000s.
Models from Moody’s indicate that they expect prices to continue falling at a similar pace. I view these forecasts as extremely conservative due to what’s going on in the existing home sales market and with purchase mortgage applications, but most markets are expected to decline between 7% and 10% in 2023 and to keep falling after.
That’s a tough pill to swallow for buyers looking to put down money on a house and pay a mortgage with a 7% handle. And of course, as many borrowers found out in 2008, you can’t “date the rate” if you don’t have enough equity to refinance.
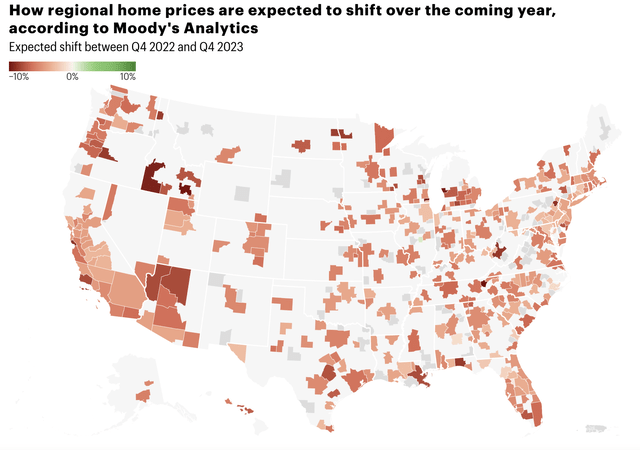
2023 US Housing Market Forecast (Fortune)
The data speaks for itself. Home prices are high and falling, albeit from ridiculous levels, and there isn’t anything that will change the trend anytime soon. In my opinion, prices are likely to fall more than 25% from peak to trough, and probably more than 30%. I’ve done a fairly extensive series on why, which I encourage anyone who is interested to read.
Housing Market Myths and Facts
I’ll close this article by correcting a few misconceptions people have about the housing market.
Myth #1- Mortgage rates are low, so no one will sell.
The fear from some pundits is that higher mortgage rates will dissuade sellers, therefore choking the supply of housing. This is true on one level but false on another. It’s true that the Fed’s rate hiking campaign means that sellers are disincentivized from selling and losing their low mortgage payments.
However, if I put a house on the market and go buy another, is that net supply? False. It’s not net supply because I’m selling one house and buying another. 1-1=0. Net supply does come, however, from job changes (i.e. unemployment), divorce, and death, which are unpleasant realities of life.
As parts of the population experience these, they will sell their homes, buyers will buy at higher mortgage rates, and prices will adjust. And people aren’t always economically rational! Sometimes people will take a job in another city and sell their house, even if it means they net less money.
Myth #2- We aren’t building enough homes, so there’s a housing shortage.
This is another really interesting myth because it’s also true on one level and false on another. It’s true that housing supply did not meet housing demand in the 2010s and early 2020s.
This is because demand for second homes, investment property, etc., increased faster than supply. However, if you measure housing demand by demographics, per capita housing supply is higher than in 2008 in most states.
I covered this extensively in my housing series. Adding net housing supply near areas where there’s strong labor demand is a good goal for the public sector. I think doing so would help the US economy, but the idea that the market failed to build enough houses for changing demographics is false.
Myth #3- Housing is a great inflation hedge
Like stocks, housing is often thought of as a good inflation hedge. This was true in the early stages of inflation, but with the Fed aggressively raising interest rates, housing is likely to underperform inflation because interest rate hikes will hammer home prices.
Cash is actually a much better hedge against inflation in this kind of environment. Moreover, housing was a better hedge against inflation in the 1970s than it is now due to urbanization (which is now complete), faster population growth (which is now nearing decline), and the fact that real estate was a better tax shelter in decades past than it is now.
Here’s an interesting study done by Aaron Brown, a Bloomberg columnist and former risk manager for AQR and Morgan Stanley. Brown found a correlation of about 0.25 for monthly inflation to home prices, meaning for each additional 1% rise in inflation, homes would appreciate about 0.25% faster than their typical 4% per year range.
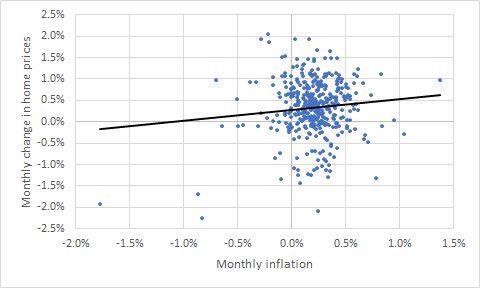
Home Prices Vs. Inflation (Monthly) (Aaron Brown)
Over a five-year period, the correlation is actually a bit less than zero, meaning that housing is historically not a good inflation hedge at all.
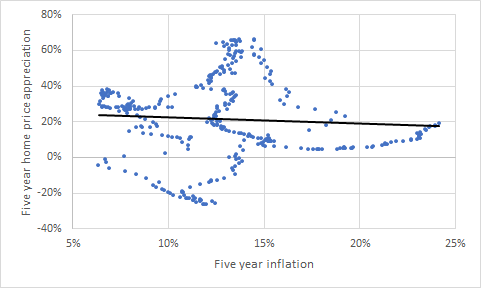
Home Prices Vs. Inflation (5-Years) (Aaron Brown)
This seems to indicate to me that like equities, housing is good at keeping up with inflation in the long run if you pay something close to a reasonable price for the asset. However, during inflation shocks themselves, both housing and stocks tend to do poorly.
The hidden third variable here may be interest rates – while stocks and real estate initially respond well to inflation, the inevitable interest rate hikes that follow tend to push their prices back down.
Source: seekingalpha.com

