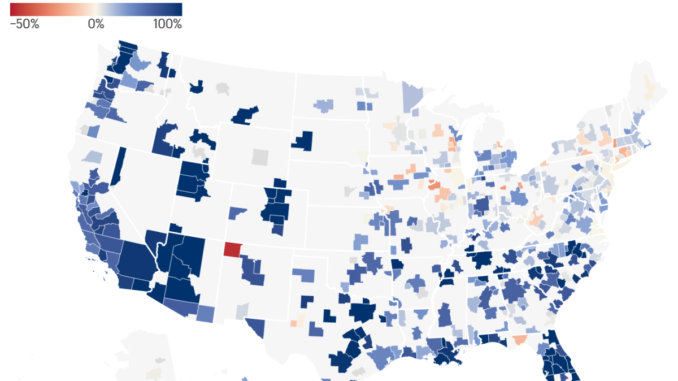
Source: Fortune —
Nationally, home prices rose for 124 consecutive months between February 2012 and June 2022. Now we’re in reverse: Through September, the seasonally adjusted Case-Shiller National Home Price Index has posted three consecutive monthly declines. In total, this 2.2% decline in the lagged resale index ties the second biggest home price correction of the post-World War II era, although it remains far below the 26% correction between 2007 and 2012.
While it’s pretty clear that pressurized housing affordability has triggered some deflation in the U.S. housing market, industry insiders remain divided on what the ongoing home price correction will look like in 2023. The reason? Demand and supply are sending mixed signals.
On the housing demand front, things remain slumped with mortgage purchase applications (down 38% year-over-year) currently just below their lowest point during the 2000s housing crash. On one hand, if financial conditions ease and mortgage rates fall in 2023, homebuyer demand would increase. On the other hand, the pandemic’s housing demand boom could’ve had a pull-forward effect that results in a slower than expected post-pandemic housing market.
On the housing supply front, things remain fairly tight nationally. While spiked mortgage rates corresponded with a huge decline in demand, it hasn’t caused sellers to rush for the exits. In fact, new listings on Realtor.com are down 17.25% on a year-over-year basis. Many buyers who would normally be looking to move up to a bigger house have postponed the switch because they don’t want to give up their fixed 2% or 3% mortgage rates they have for their current house.
So do buyers (for whom low demand is a potential tailwind) or sellers (for whom tight supply is a potential tailwind) have the upper hand? One of the best indications might be the direction of inventory—and its speed of change. At first glance, it might be easy to assume that inventory (i.e. active listings for sale) is simply a measurement of supply, however, it’s also a measurement of demand. If homebuyers pull back, and homes sit on the market longer, that can increase inventory levels (currently up 46.8% year-over-year) even if new listings (currently down 17.3% year-over-year) decline.
Let’s take a closer look at inventory data in the nation’s 400 largest markets.
The post Where are home prices in America’s 400 largest housing markets headed in 2023? These 5 charts give us some clues appeared first on Weekly Real Estate News.


