Now that we are halfway through the year, we can see that active inventory in America is growing, unlike what happened in 2023. This is precisely what the doctor ordered for the housing market.
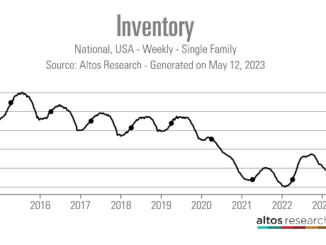
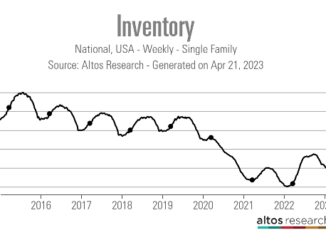
In March of 2022, we only had 240,000 active single-family homes available for sale, leading me to call the housing market savagely unhealthy as we simply had too many people chasing too few homes. We are currently up to 652,573 single-family homes, and while that isn’t close to average active inventory levels, it’s a much better place today than in 2022. Let’s take a half-time look at the inventory levels in America today.
Weekly housing inventory data
While inventory growth this week slowed to 6,803 —well below my weekly target level of 11,000 -17,000 with elevated mortgage rates — the fact that we hit this target level five times this year versus zero last year is a big reason why 2024 has been a much better year for housing than 2023. As we can see below, it’s a much healthier year in inventory growth data than in 2023.
Weekly inventory change (June 29-July 5): Inventory rose from 645,770 to 652,573
The same week last year (June 30-July 7), Inventory fell from 466,534 to 466,001
The all-time inventory bottom was in 2022 at 240,497
This week is the inventory peak for 2024 at 652,573
For some context, active listings for this week in 2015 were 1,183,882


