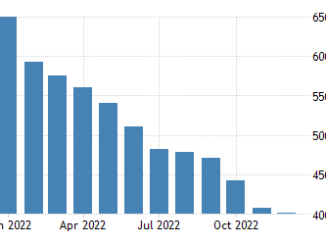
Everyone knows it’s been a very dry 18 months for home sales. As mortgage rates rose starting in 2022, payment affordability got dramatically worse and homebuyer demand dried up. At the same time, seller volume dried up.
But now sellers are coming back into the market. New listing volume last week was 18% more than a year ago. Total available inventory is gradually climbing about 1% per week — last year it was still declining in April. As we roll into the second quarter, we should have accelerating inventory growth each week.
All of these signals point to rising home sales in 2024. Last year was very, very low, so “rising” isn’t very difficult. There are still a lot of people who assume that mortgage rates need to fall before we see a rebound in home sales, but the data shows that we only need stability in the mortgage markets.
Pending sales
Last week saw 69,000 new contracts for single-family home purchases across the country. There were another 15,000 condo sales started. That’s up 3% for the week and it’s a healthy 13% more sales than a year ago. That brings us to 367,000 single-family homes in the contract pending stage. That’s 7% more home sales than a year ago.
When mortgage rates rose in January February and into early March, that sales growth slowed. But as we’re now seeing a month or so of mortgage rate stability, we see the sales starting to pick up again.
I was discussing with HousingWire’s Lead Analyst Logan Mohtashami about comparing the Altos pending sales data to other indicators of home sales, specifically the Mortgage Bankers Association’s purchase mortgage applications index. This index that tracks mortgages is still not really showing growth over last year. But our pending sales data is very obviously showing growth.
Why the difference?
One reason may be that we have had a shift to more cash purchases. NAR reported 33% all cash buyers, which is the most since 2014 when buyers were still cleaning up distressed properties. So home sales may be a bit decoupled from the MBA mortgage data for a while.
New listings
New listings dipped a little from the previous week but there were still 22% more sellers hitting the market last week than the same week last year. That’s 18% growth over last year when we include the immediate sales that were newly listed and are already in contract. The immediate sales don’t add to active inventory, they’re already pending.
That’s 60,000 new listings and another 17,000 immediate sales. Not only are the new listings growing, but also there were 8% more immediate sales than a year ago. These are all encouraging signs for sales volume in the housing market. More sellers means more sales in 2024. This is underway and the trend seems very clear to me. I suppose this trend could reverse if we have another mortgage rate shock with rates jumping back closer to 8%.
Total inventory
New listings are up 18% year over year. New contracts are also up, but only 13%, so total inventory of unsold homes is growing. I’ve shown how last year was very obviously a supply-constrained market. This year the dynamic is different. The longer mortgage rates stay higher, the more inventory will build.
There are now 517,000 single family homes on the market. That’s 26% more homes for sale now than a year ago. Inventory has now expanded for 20 weeks in a row. The takeaway here is that this expansion of inventory is from mortgage rates staying high. If rates fall notably, homebuyer competition will heat up and this inventory growth trend will finally reverse.
We should have close to 700,000 homes on the market in August or September. That’ll feel like a lot! It won’t be a lot actually, but it’ll be the most homes available since 2019. The longer we stay at higher mortgage rates, the more inventory can build back to the old normal levels.
Pendings price
The median price of all the homes that got offers last week is $393,775 — that’s 5% higher than a year ago.
This is the price of the new pendings. This is a different price measure than I usually share in Altos weekly reports. There are many ways to measure “home prices.” Do we want to look at the price of the houses that closed escrow last month? The asking price that homebuyers will see if they want to buy? Or in this case, the price of those that get offers — indicating where the buyer demand is?
Normally we talk about the asking price of all the homes on the market. If you want to buy a house and you walk into the market today, the median price of single-family homes in the U.S. is $439,900. That’s up a fraction from last week and only half a percent higher than it was last year at this time.
But if we look at the price of the homes going into contract, we can see where the buyers are and the price they’re paying before the sale is closed in the next month or two. The median price of the new contracts pending this week is $393,775. That’s 5% higher than a year ago.
Price reductions
The one area I’ve been sensitive to are price reductions: the percent of homes on the market which have had to lower their asking price. There are now 31.9% of the homes on the market with a price cut from their original list price. That’s up 50 basis points from the previous week and is 1.4% higher than a year ago.
Because we had so few sellers at this time last year, you can see how this data point is a good indicator of supply and demand balance: buyers were grabbing any good property that was available. In most markets now, buyers feel like they have less urgency and sellers react to that fact.


