Housing professionals already know that high mortgage rates are bad for business. And they hope that rates will soon fall.
But with mortgage rates ascending past 7% according to HousingWire’s Mortgage Rates Center, those hopes have so far been dashed in 2024.
Armed with data from HousingWire sister company Altos Research, we can see in minute detail how the housing market responded to the recent 7%-and-higher rate environment and what the market may see again soon.
Bad for sellers
Prospective home sellers may not notice incremental changes in mortgage rates. But when rates rocket up—as they did when the Federal Reserve raised the federal funds rate 11 times for a total increase of 5.25 percentage points—sellers take notice.
They notice their loss of purchasing power. They notice when they cannot afford to buy the same size house they have today or when the same size house would cost hundreds or thousands more per month.
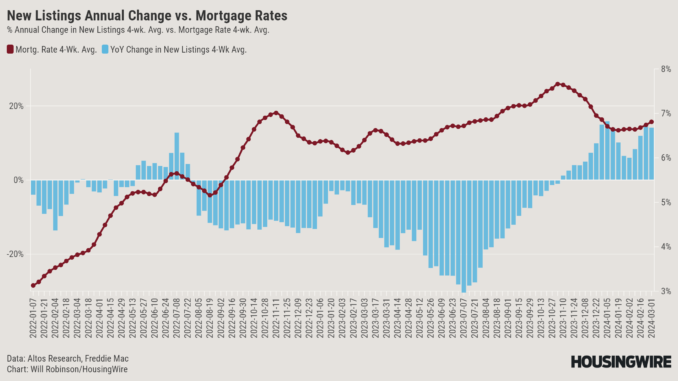
Facing these realities, many would-be sellers decide to stay put. This is clear in the chart below, which shows the year-over-year percent change in the four-week average of new listings. Year-over-year change accounts for seasonality, and four-week averages smooth out weekly volatility.
This data, courtesy of Altos, shows that new listings retreat when rates rise and accelerate when rates fall:
High rates are bad, too, for the sellers who decided to list their homes.
When rates saw their initial run up in 2022, the percentage of listings nationwide that had a price cut increased to a four-week average high of 43.1% – a 54% increase year-over-year. In the first half of 2023, the year-over-year increase in the share of listings with price cuts rose as high as 80.7%.
Throughout 2023, the share of listings with price cuts was slightly lower than in 2022 but still much higher than the buying boom in 2021.
In the first week of March, for example, the share of listings with price cuts ranged 25-27.2% in 2019-2020, 16.9-17.2% in 2021-2022 and 30.5-31% in 2023-2024.
The story is similar, but more nuanced, for median price per square foot (PPSF).
The median PPSF was able to maintain its rise throughout mortgage rates’ ascent from a four-week average of 3.13% to 5.65%, reaching a peak of almost $219 in July 2022. But as rates rose to 7%, both the year-over-year growth in PPSF and the actual PPSF began to fall.
PPSF actually fell year-to-year in May to September of 2023 as rates again rose to and then past the 7% mark. When rates rapidly fell at the end of 2023 and plateaued in early 2024, PPSF began to rise again.
Similarly as interest rates rose, listings spent more time on market.
Sellers and prospective sellers thus face the following conditions when rates rise steeply: a higher probability of needing to cut their listing prices, less pricing power in terms of PPSF and more time needed to sell their properties.
No wonder, then, that many sellers decided to pull their listings.
The following chart depicts listings that were taken down – either because the home sold or the listing was withdrawn – or sold within a week of posting (“immediate sales”). In times when mortgage rates shoot up, the share of withdrawn listings grows; the reverse is also true.
Bad for buyers
The impact of high mortgage rates on buyers is twofold. The more obvious impact is that buyers can afford less when it costs more to borrow money.
The buying power of a prospective homebuyer who can pay a 20% down payment and can pay the equivalent of the going market rent towards a monthly mortgage payment shrunk from $501,000 in the third quarter of 2021 to $332,000 in the third quarter of 2023, Cushman & Wakefield estimates. With buying power suppressed and home prices high, the median priced home has been unaffordable to this cohort for more than a year.
The second impact is a lack of inventory, since would-be sellers are less inclined to list their homes and prospective sellers are more likely to pull their listings and wait for a more advantageous time to relist their homes. This has resulted in a record high number of owner-occupied homes and a rapidly rising number of renter-occupied homes – both of which have come at the expense of the number of homes for sale.
Many builders, too, see more opportunity in building homes for rent than for purchase until buyers get their purchase power back with lower rates.
The return of 7%
As rates started rising last month, some of the factors outlined above have begun to show their faces again. The year-over-year gains in new listings have been decelerating, as have the year-over-year declines in the share of listings with price cuts.
The data below reflects the year-over-year change percentages from each week’s actual total rather than its four-week rolling average.
Median days on market, however, shrank over the same four weeks, and median PPSF strengthened moderately.
Surely many eyes will monitor the path of mortgage rates and these home listing performance metrics in the weeks to follow as we approach a meeting of the Federal Reserve Open Market Committee this month, a meeting many observers do not expect to result in a rate cut.
Given the power of mortgage rates, it is small wonder housing economists don’t forecast meaningful improvements to the nation’s for-sale housing woes until rates fall below 6%. That is a level far from view today.
ENB
Sandstone Group


