USD/MXN climbs as Mexico’s inflation cools down
Wall Street is trading mixed, with the S&P 500 and the Nasdaq posting losses while the Dow Jones climb. The USD/MXN is registering solid gains on data from Mexico, showing that inflation is cooling down. Data from INEGI showed that inflation rose by 6.85% YoY, below estimates of 6.90%, as revealed by a Reuters poll. Core inflation, which excludes volatile items, cooled from 8.09% to 8.09% annually.
Last week, Banxico (the Mexican central bank) raised rates by 25 bps moderating the pace of tightening. Analysts expect Banxico to keep rates unchanged at around 11.25%,
On the US front, the ISM Non-Manufacturing PMI dropped to 51.2, which is lower than the anticipated 54.4 and falls short of the previous month’s reading of 55.1. The decline is attributed to a decrease in new orders growth and less robust business activity. Meanwhile, February ADP figures showed private hiring increased by 145K, below the expected 200K, trailing January’s upwardly revised figure of 261K.
Given the latest round of labor market metrics pointing to deterioration, a jump in Initial Jobless Claims for the latest week could open the door for a weaker US Nonfarm Payrolls figure. Analysts predict that the number of payrolls for March will be around 240K, which is lower than February’s figure of 311K.
USD/MXN Technical analysis
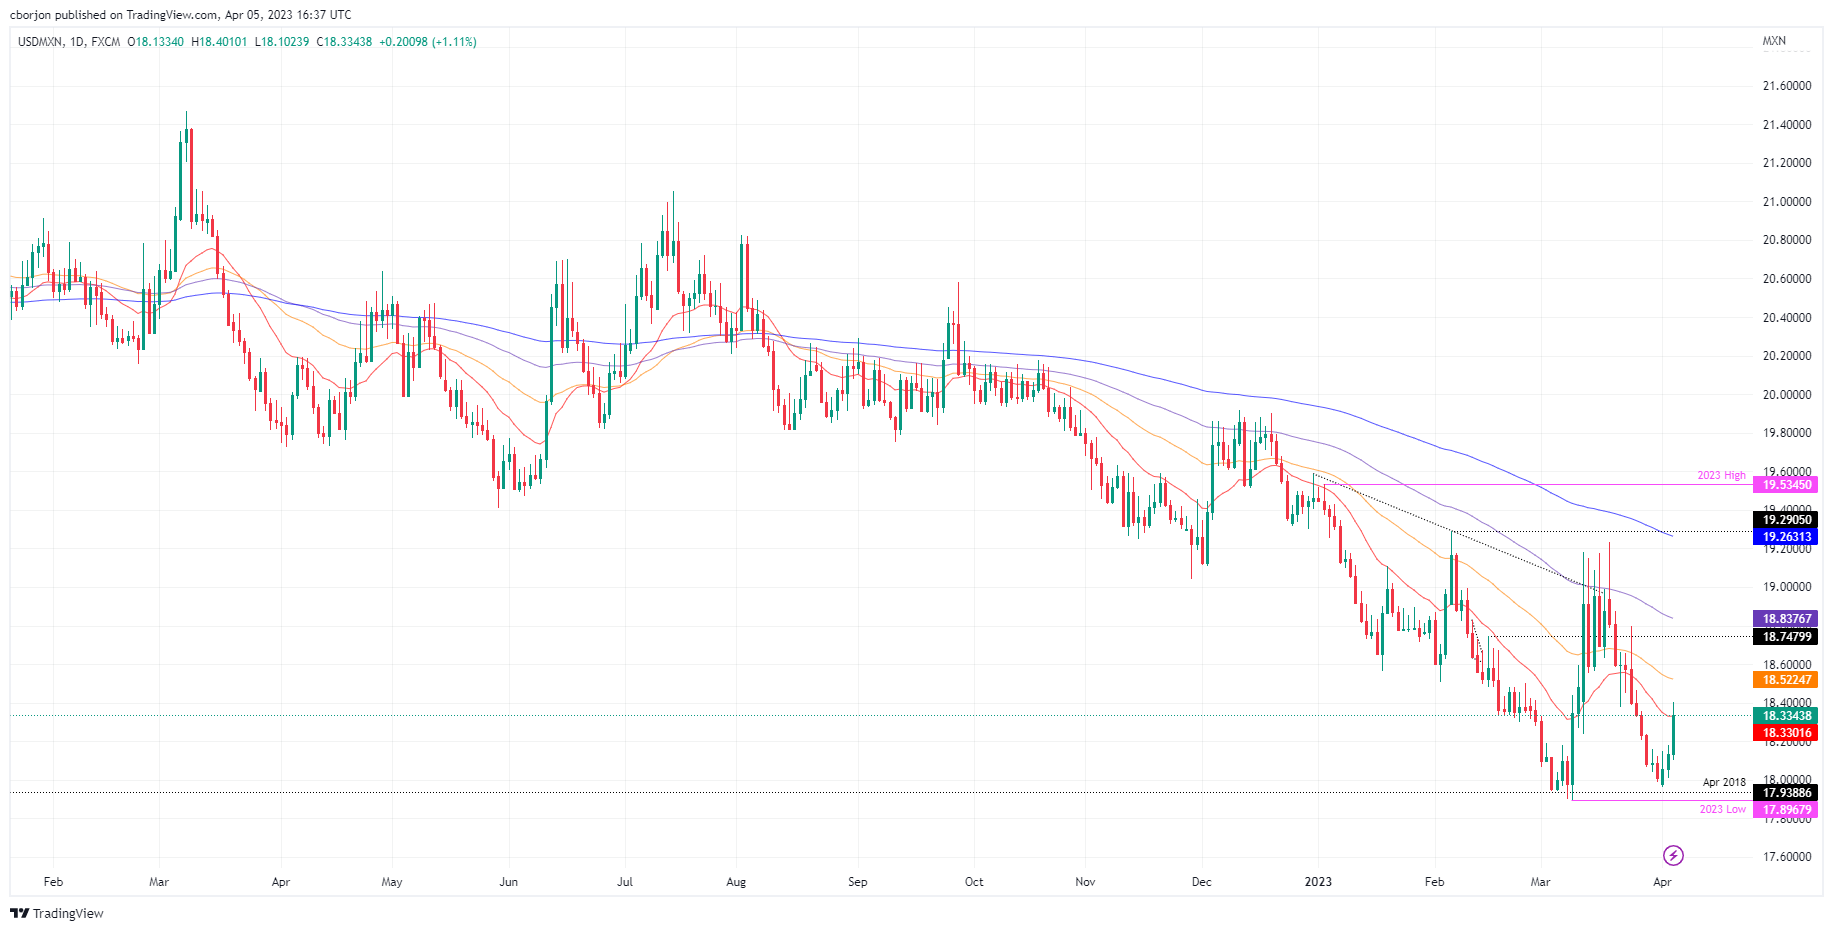
The USD/MXN appears to have bottomed at around 18.0000. USD/MXN weekly gains above 2% spurred a rise from 17.9644 toward 18.4000, exposing the 20-day Exponential Moving Average (EMA) at 18.3329. A daily close above the latter could exacerbate a rally towards the 100-day EMA At 18.8382, but firstly, buyers need to clear the 50-day EMA At 18.5235. On the other hand, a dip below the 20-day EMA and the USD/MXN could re-test 18.0000.


